Long-term rate increase signals potential housing market shift
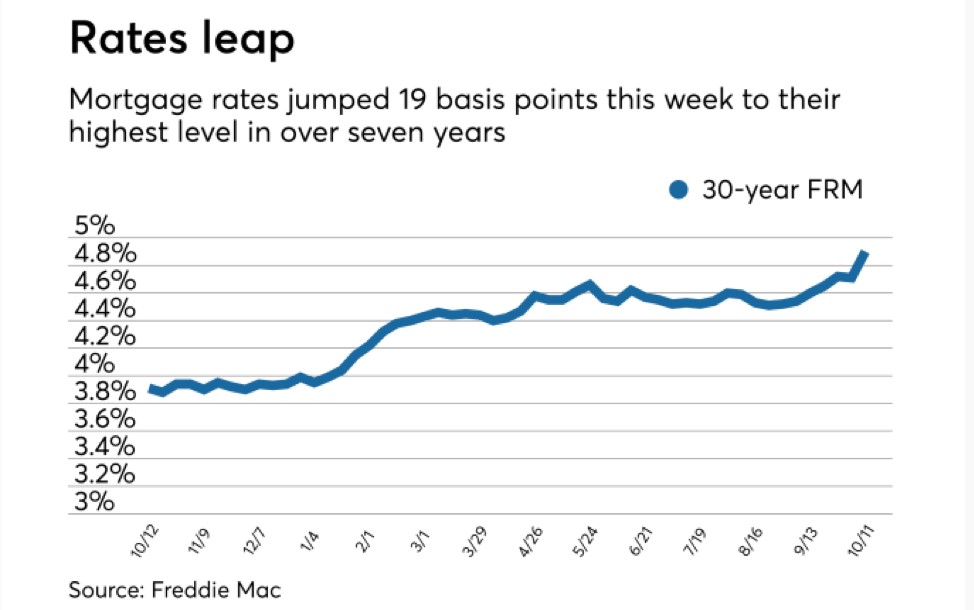
Another bump in long-term interest rates this week may signal a shift in the housing market. Just two years ago the rate on a 30-year fixed-rate mortgage dropped below 3.5 percent. This week, that interest rate is quickly approaching 5% as Freddie Mac reported that the average 30 year mortgage rate hit 4.90% the highest level in over seven years.
For anyone who didn't buy a home in the 1980's, a 5 percent interest rate will seem like a monster price tag, especially considering the seller's market and high home prices we've seen for the last couple of years. But when you look back across nearly two decades of data, the median rate on a 30-year fixed mortgage sits right around 4.5 to 4.6 percent. In short, we aren't that much higher than the median rate for close to 20 years.
A more recent chart from Freddie Mac shows the dramatic rise in the last twelve months:

Still, seeing higher rates can elicit an emotional reaction from buyers. Two things could happen: buyers could hold off in hopes of prices going down, or they can strike before the rates head even higher.
Market Rumblings

Market volatility is alive and well this week as the markets digest inflation data, and more importantly, continued concerns about the unresolved trade dispute between China and the United States and overall higher rates. The 10 Year Treasury Note recently topped out a 3.25% late last week and has seen more volatility this week as the bond market digests some benign inflation data. The 10 Year Treasury Note currently sits at 3.16% as equites look to rally back from a two day thrashing where we observed a 1,378 point drop (5.2%) on the Dow, a 409 point drop (5.3%) on the Nasdaq and a 152 point drop (5.3%) on the S & P.
This time around has been an interesting move where equities and bonds both lost value. Over the past 20 years, statistics show a stock sell-off would push everyone to the relative safety found in Treasurys. That wasn't the case this week. Instead, investors have been selling off longer-dated Treasurys, negating the safety net typically found in the government debt market. According to Larry Mcdonald with ACG Analytics, "in the past three years there have only been 14 trading days, including today, where the S&P 500 was lower more than 1% and US Bonds were also lower on that day."

Notable Moves
- A lower-than-expected CPI released by the Bureau of Labor Statistics has quelled fears of inflation and has broadened the yield curve between 10-year and 2-year bonds. This brought the 10-year note yield down from its 10-year-high earlier this week.
- The US dollar has softened after the stock sell-off and a lower-than-expected Core CPI.
- The Bureau of Labor Statistics shows PPI for final demand increased 0.2 percent in September 2018, seasonally adjusted.
- According to the BLS, the index for final demand less foods, energy and trade services moved up 0.4 percent in September. That's the largest rise since a 0.5 percent increase in January of this year.


