Will the Fed delay its rate hike?
The stock market bounced back this past week to record its seventh consecutive daily gain since selling off on Wednesday, May 17 following media speculation about the FBI's investigation of potential Russian interference in the U.S. presidential election. Meanwhile, the bond market largely traded sideways with mortgage bonds edging almost five basis points higher and mortgage rates holding steady.
Last Wednesday, the Federal Reserve released the minutes from their May 2-3 FOMC meeting and there were no strong reactions from the stock and bond markets. The minutes showed Fed officials were pondering on whether or not the first-quarter slowing in economic growth would be reversed during the second quarter. However, Fed officials will only have about half of the 2nd Quarter's economic data they will need to make a rate decision by their June 14 meeting, so there is a possibility the Fed may have to delay their next rate hike until September. However, the Fed Funds Futures market is currently pricing in an 83.1% probability for a rate hike in June.
Fed officials also discussed their intention to gradually reduce the Fed's $4 trillion balance sheet by shrinking their holdings of Treasury bonds and mortgage-backed securities. This will likely put upward pressure on longer-term interest rates beginning later in the year.
There were several key economic reports from the housing sector this past week. Tuesday, the Commerce Department reported new home sales fell 11.4% from nearly a 9-1/2-year high in April to a seasonally adjusted annual rate of 569,000 units.
However, March's new home sales number was revised higher to 642,000 units (from 621,000), which was the highest level since October 2007. The inventory level for new homes on the market increased 1.5% to 268,000 units and at April's sales rate it would take 5.7 months to deplete the supply of houses on the market, up from 4.9 months in March.
Overall, the upward revisions in new sales for prior months more than compensated for the decline in April relative to the consensus forecast. Therefore, the April report is not as poor as it initially appeared and the housing recovery likely remains unharmed within a tightening labor market.
Wednesday, the Federal Housing Finance Agency (FHFA) announced their House Price Index advanced 0.6% during the month of March. This was slightly higher than the forecast of 0.5%. Year-over-year, the FHFA index has increased 6.2%.
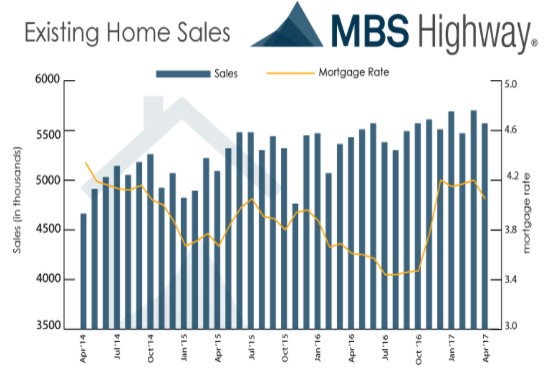
Further, the National Association of Realtors reported existing home sales fell 2.3% during April to 5.570 million units to come in below the consensus forecast of 5.650 million units. Sales were 1.6% higher year-over-year. Total housing inventory increased 7.2% to 1.93 million existing homes (9.0% lower than a year ago) marking the 23rd consecutive year-over-year decline.
Unsold inventory increased to a 4.2-month supply versus 3.8 months in March based on April's sales rate. The median home price for all housing types increased 6.0% to $244,800 while the median price for existing single-family homes rose 6.1% to $246,100.
As for mortgages, mortgage application volume increased during the week ending May 19. The Mortgage Bankers Association (MBA) reported their overall seasonally adjusted Market Composite Index (application volume) rose 4.4%. The seasonally adjusted Purchase Index dropped 1.0% from the prior week, while the Refinance Index increased 11% to its highest level since March.
Overall, the refinance portion of mortgage activity increased to 43.9% total applications from 41.1% from the prior week. The adjustable-rate mortgage share of activity increased to 8.2% of total applications. According to the MBA, the average contract interest rate for 30-year fixed-rate mortgages with a conforming loan balance fell to 4.17% from 4.23% with points increasing to 0.39 from 0.37.
For the week, the FNMA 3.5% coupon bond gained 4.7 basis points to close at $103.06 while the 10-year Treasury yield increased 1.54 basis points to end at 2.250%. Stocks ended the week higher.
The Dow Jones Industrial Average added 275.44 points to end at 21,080.28. The NASDAQ Composite Index advanced 126.49 points to close at 6,210.19 and the S&P 500 Index gained 34.09 points to close at 2,415.82.
Year to date on a total return basis, the Dow Jones Industrial Average has gained 6.67%, the NASDAQ Composite Index has advanced 15.36%, and the S&P 500 Index has risen 7.91%.
This past week, the national average 30-year mortgage rate held steady at 4.02%; the 15-year mortgage rate was unchanged at 3.28%; the 5/1 ARM mortgage rate was unchanged at 3.09%; and the FHA 30-year rate was unchanged at 3.75%. Jumbo 30-year rates decreased to 4.30% from 4.31%.
Mortgage Rate Forecast with Chart – FNMA 30-Year 3.5% Coupon Bond
The FNMA 30-year 3.5% coupon bond ($103.06, +4.7 bp) traded within a narrower 40 basis point range between a weekly intraday high of $103.17 on Friday and a weekly intraday low of $102.77 on Wednesday before closing the week at $103.06.
The bond churned sideways on Monday and Tuesday before edging marginally higher on Wednesday. Interestingly, the bond closed at the same value of $103.06 on Wednesday through Friday. Thursday, there was a weak buy signal from the slow stochastic oscillator taking place while "overbought." This suggests the bond could remain range-bound between current technical support ($102.806) and resistance ($103.297) this coming week unless the economic data from the May Employment Situation Summary (Jobs Report) on Friday triggers a strong reaction in the bond market.
Last week's Initial Jobless Claims data will serve as the "sample week" for modeling and estimates for the upcoming ADP and Jobs Reports. This data suggests there could be a stronger than forecast May jobs report that could result in a negative reaction in the bond market to send mortgage bond prices lower and interest rates slightly higher.