Economic optimism building despite delays, declines
It will be at least April until President Trump and Chinese President Xi Jinping meet to discuss further negotiations on a trade deal between the two countries. The markets continue to rally on renewed optimism for a trade deal as the S&P and Nasdaq rallied another 2-plus percent and the Dow increased another 1 percent for the week. Meanwhile, the 10-year Treasury note fell below 2.60 percent, approaching lows not seen since early January, bringing mortgage rates lower with it.
On Thursday, President Trump said that the U.S. will know in the next three to four weeks about a possible deal with China. During his St Patrick's Day reception at the White House, Trump said, "If that one gets done it will be something that people will be talking about for a long time."
World markets continue to watch and react to what's happening in the United Kingdom. March 29 was the official date for Brexit, the withdrawal of the United Kingdom from the European Union. However, Prime Minister Theresa May won her vote in favor of a delay. There is no definite date set for the delay deadline, but many believe that it will extend into June.
Both U.S. and European stocks were up on the news and Chinese shares were also up as the Chinese government announced plans for tax cuts.
CONSUMER PRICES GO UP
For the first time in four months, consumer prices went up. February saw a modest gain in the Consumer Price Index, just 0.2 percent according to the Labor Department, affected mainly by increases in rent, food and gasoline.
The core CPI, which excludes volatile markets like food and oil, had its smallest increase since August of last year with just 0.1 percent. There were notable drops in prices for automobiles and prescription drugs. The CPI data shows that, for the first time in four months, the price of cars went down. It also shows a 1 percent drop in prescription drug prices marking an annual decline of 1.2 percent, the largest drop since the early 1970s.
These increases in CPI and core CPI were also below what economists had predicted. The year-over-year core CPI rate actually went down to 2.1 percent. That key underlying measure of inflation will likely serve as an affirmation of the Federal Reserve's patient stance on rates.
Retail sales data released by the Commerce Department this week shows a sharp revision down for the month of December with a slight rise in January.
December's numbers were revised down to show a 1.6 percent decrease instead of the previously reported 1.2 percent decrease. January's numbers, however, finished out well above expectations, coming in around a 2.3 percent increase from one year ago.
A look at the core retail sales numbers, which exclude automobiles, gasoline, building materials and food services, gives us a bigger picture of the economy as a whole. December's numbers for core retail sales were revised down to a 2.3 percent decrease, the largest drop since the year 2000. January's numbers show a 1.1 percent increase in core retail sales, but that's not nearly enough to offset December's drop.
It's likely that the core retail sales data will force the government to revise down its fourth quarter Gross Domestic Product growth percentage from 2.6 percent down to 2.1. These numbers continue to show an economy that is still growing, but definitely not at the pace it was over the last couple of years.

PRESIDENTIAL BUDGET SUBMITTED
While mostly symbolic in nature, the President's Budget that was submitted to Congress this week can actually give analysts a good basis for predictions in the coming months. The budget submitted by President Trump concentrates on increased military spending and, of course, a budget for the border wall.
The bulk of the $4.7 trillion dollar plan from Trump asks for $8.6 billion to build the border wall. The deadline for Congress to approve spending for that wall is Sept. 30, 2019 or risk another government shutdown. There are also provisions for overhauling Medicaid and Medicare but noticeably no concentration on reducing the United States' federal deficit.
The military spending is interesting because Trump's proposal doesn't look at increasing the spending caps, rather it suggest an increase in emergency military spending which is exempt from those imposed caps. It also proposes letting the nominal spending levels decline. The proposal also outlined steep cuts to non-defense spending for the Environmental Protection Agency and the State Department. The proposal would also cut funding for foreign countries by $13 billion.
Not surprisingly, Democrats in Congress immediately rebuffed the proposal, with Democratic Senator Patrick Leahy stating that the plan "is not worth the paper it is printed on."
Analysts from Goldman Sachs view this proposal with increased downside risk for Fiscal Year 2020. This means they believe there is greater risk for the actual return being less than the expected return. And as the border wall debate rages on, the risk for another government shutdown is seen as high.

HOUSING MARKET PICKING UP FOR SPRING
Mortgage applications went by up 3 percent from the previous week according to data released on Wednesday by the Mortgage Bankers Association.
Joel Kan, the MBA Vice President of Economic and Industry Forecasting, said "Purchase applications have now increased year-over-year for four weeks, which signals healthy demand entering the busy spring buying season. However, the pick-up in the average loan size continues, with the average balance reaching another record high."
New home sales data released by the Commerce Department Thursday morning show people held off on buying new homes in January. New home sales were down 6.9 percent, a much higher percentage than the expected 0.9 percent decline. It's not a stretch to believe the government shutdown in January, as well as a somewhat volatile stock market, had people holding off on buying a new home.
Going along with the recent trend, the median sales price of a new home fell by a little less than 4 percent, down to $317,200 for the month of January.
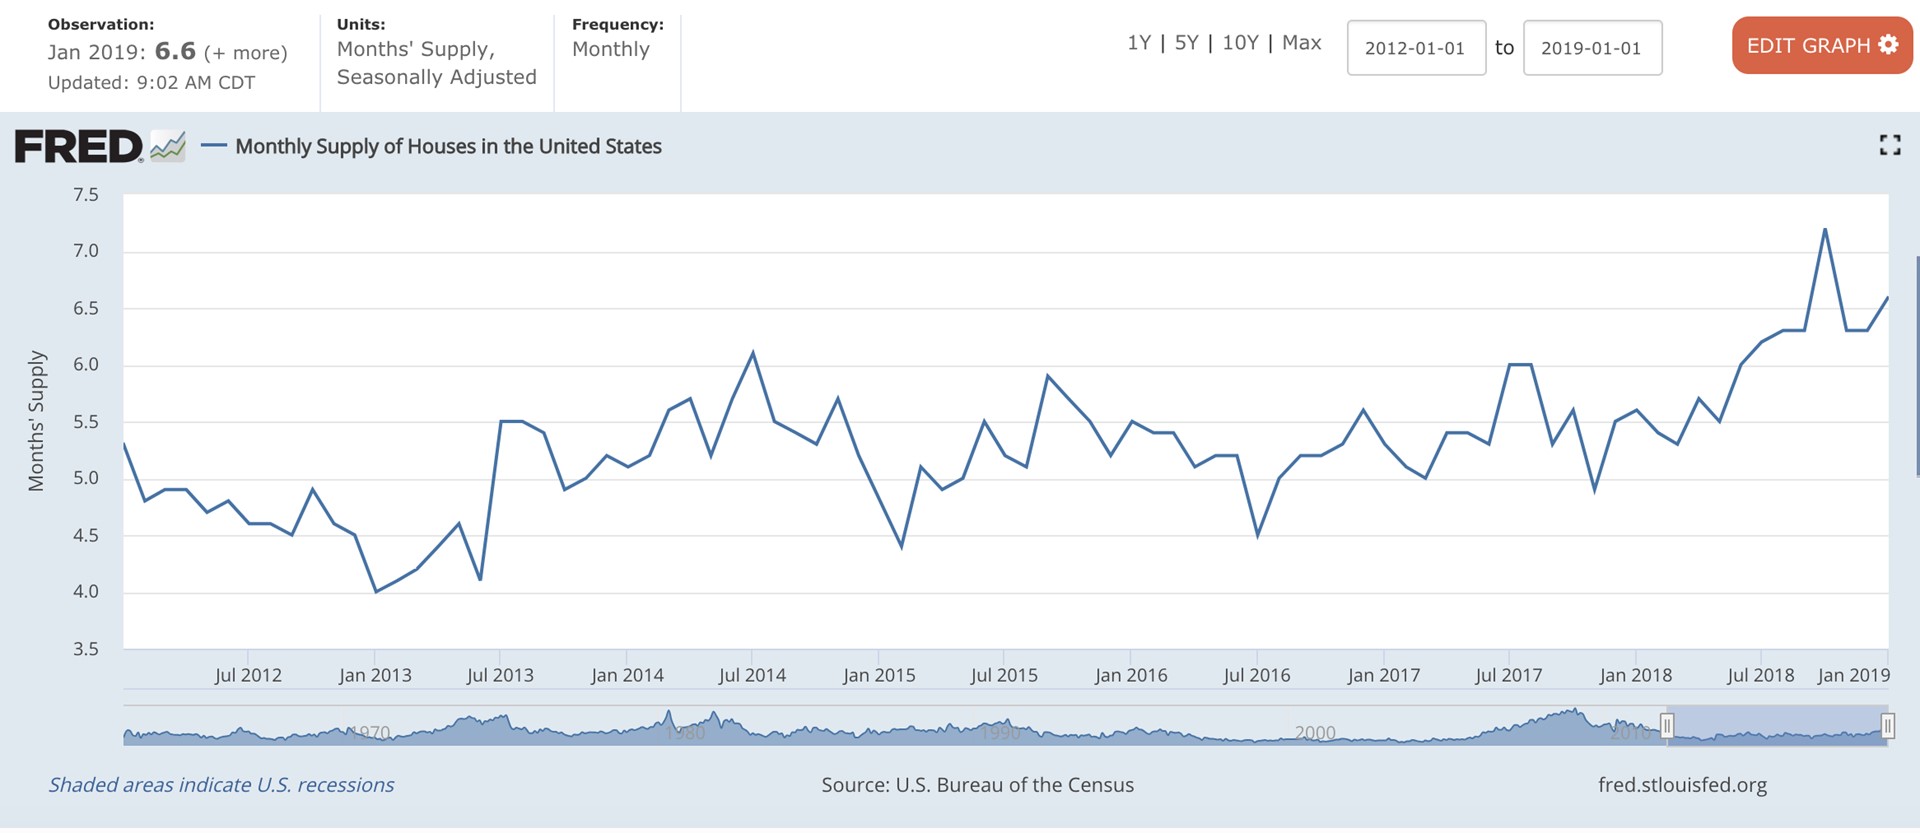
The big positive that comes from that is housing inventory is creeping back up. The chart below from the Federal Reserve Bank of St. Louis shows housing inventory data from the Census Bureau from January 2012 to January of 2019. You can see that supply has increased to 6.6 months. That means with the current inventory, we would run out of available houses for purchase in 6.6 months.

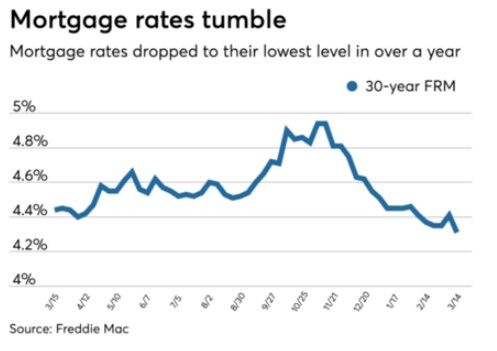
So right now we are continuing in this pattern of low and stable rates, high inventory and home prices that are cooling off. In fact, according to Freddie Mac's Primary Mortgage Market Survey, the 30-year fixed-rate mortgage averaged just 4.31 percent for the week ending March 14, 2019.

Fannie Mae's Mortgage Lender Sentiment Survey also shows some positives with the net profit margin outlook for mortgage lenders much higher than it was at the end of 2018


