Spring real estate starts strong as mortgage applications rise
Weekly Review
The stock market continued to march ever higher, especially early in the week when both the small-cap Russell 2000 and the technology-laden Nasdaq Composite Indexes reached record highs. In fact, the Nasdaq Composite broke above the 6,000 mark for the first time ever. Investor sentiment was enhanced in response to the election results in France when pro-European Union globalist Emmanuel Macron received more votes than anti- European Union nationalist Marine Le Pen during the first round of presidential elections. The two candidates will now square off in a runoff election on May 7.
However, other political developments both here and abroad managed to keep investors wary. President Trump's proposal for meaningful tax reform, threats to pull out of NAFTA, a revised plan repeal and replace Obamacare (The Affordable Care Act), and escalating tensions between the U.S. and North Korea over the North Korean's ballistic missile testing all combined to impact investor sentiment.
Bond yields crept higher as talk of potential tax cuts negatively impacted Treasury prices early in the week. The yield on the 10-year Treasury reached its highest level in over two weeks on Wednesday, before pulling back as investors contemplated the possibility of a potential government shutdown.
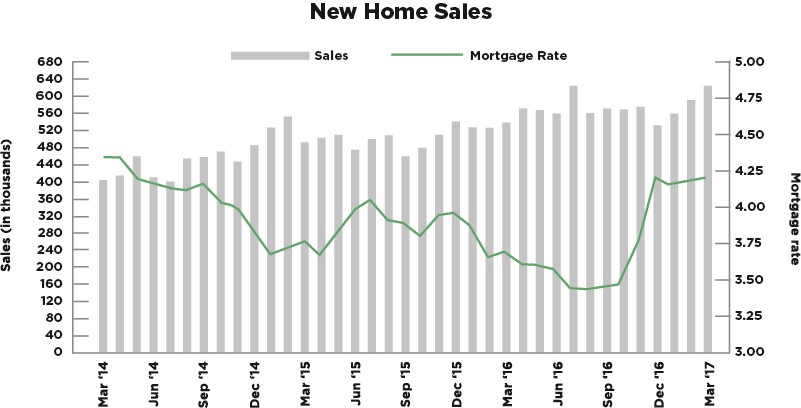
In housing, the spring home selling season got off to a great beginning as New Home Sales soared to an 8-month high in March. The Commerce Department reported New Home Sales at a seasonally-adjusted annual rate of 621,000 for March, easily exceeding the consensus forecast of 590,000. March sales were the second-strongest since early 2008, and were just slightly lower than last July's reading of 622,000 while being 15.6% higher than a year ago. The median home sales price increased 1.2% to $315,000 and is 1.2% higher compared to a year ago while the average sales price increased 5.6% to $388,200. Inventory continues to slide and at the current rate of sales, it would take just 5.2 months to exhaust available supply.

Home prices continue to march steadily higher and this was confirmed by both the Federal Housing Finance Agency (FHFA) and S&P/Case-Shiller. The FHFA monthly House Price Index (HPI) for February showed home prices rose 0.8% in February and 6.4% annually in addition to an upward revision in January's index to 0.2%. The FHFA monthly HPI is calculated using home sales price information from mortgages sold to, or guaranteed by, Fannie Mae and Freddie Mac. Because of this, the selection excludes high-end homes bought with jumbo loans or cash sales. Meanwhile, the S&P/Case-Shiller National Home Price Index soared 5.8% in February, the largest gain in 32 months, when analysts had predicted a 5.7% increase. This is further evidence strong home buyer demand continues to outweigh supply in the housing market.
Furthermore, the National Association of Realtors reported March Pending Home Sales, based upon contract signings, retreated 0.8% to 111.4 from 112.3 in February. This slight loss in sales momentum was due to the scarcity of available inventory. Despite the decrease in March, the index is 0.8% above a year ago and was the third best reading in the past year.
In the realm of mortgages, mortgage application volume increased slightly during the week ending April 21. The Mortgage Bankers Association (MBA) reported their overall seasonally adjusted Market Composite Index (application volume) rose 2.7%. The seasonally adjusted Purchase Index decreased 1.0% from the prior week, while the Refinance Index increased 7.0%. Overall, the refinance portion of mortgage activity increased to 44.0% total applications from 42.4% from the prior week. The adjustable-rate mortgage share of activity increased to 8.7% of total applications. According to the MBA, the average contract interest rate for 30-year fixed-rate mortgages with a conforming loan balance decreased to 4.20% from 4.22%, its lowest level since November 2016, with points increasing to 0.37 from 0.35.
For the week, the FNMA 3.5% coupon bond dropped 7.8 basis points to close at $102.797 while the 10-year Treasury yield increased 4.29 basis points to end at 2.289%. Stocks ended the week higher. The Dow Jones Industrial Average rose 392.75 points to end at 20,940.51. The NASDAQ Composite Index advanced 137.09 points to close at 6,047.61 and the S&P 500 Index added 35.51 points to close at 2,384.20. Year to date, the Dow Jones Industrial Average has gained 5.96%, the NASDAQ Composite Index has advanced 12.34%, and the S&P 500 Index has risen 6.49%.
This past week, the national average 30-year mortgage rate rose to 4.09% from 4.05%; the 15-year mortgage rate increased to 3.34% from 3.29%; the 5/1 ARM mortgage rate increased to 3.08% from 3.04%; and the FHA 30-year rate increased to 3.80% from 3.75%. Jumbo 30-year rates rose from 4.32% to 4.35%.
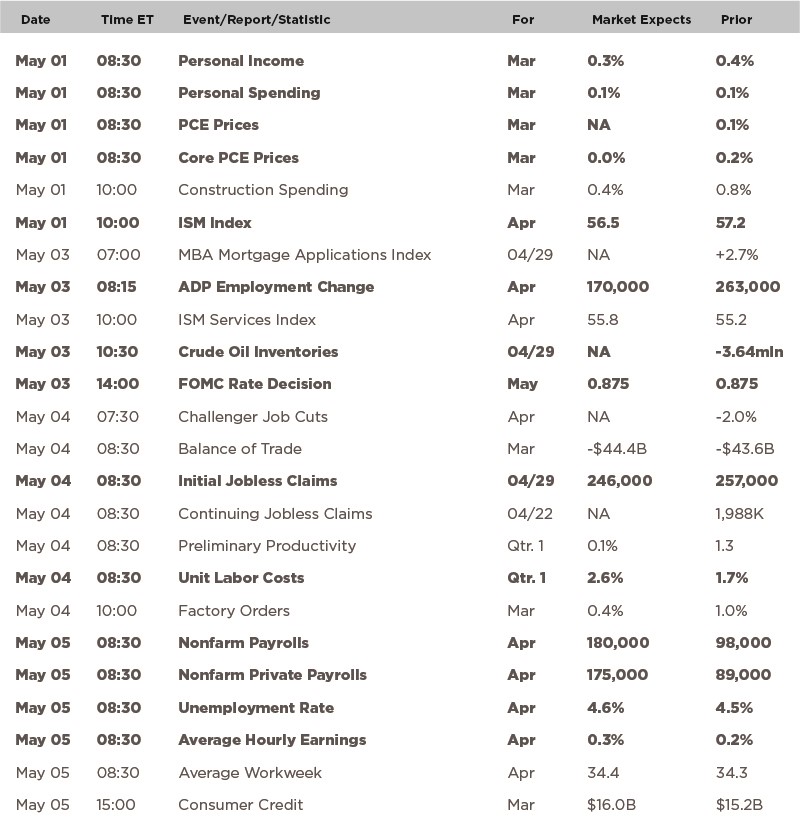
Economic Calendar – for the Week of May 1, 2017
Economic reports having the greatest potential impact on the financial markets are highlighted in bold.

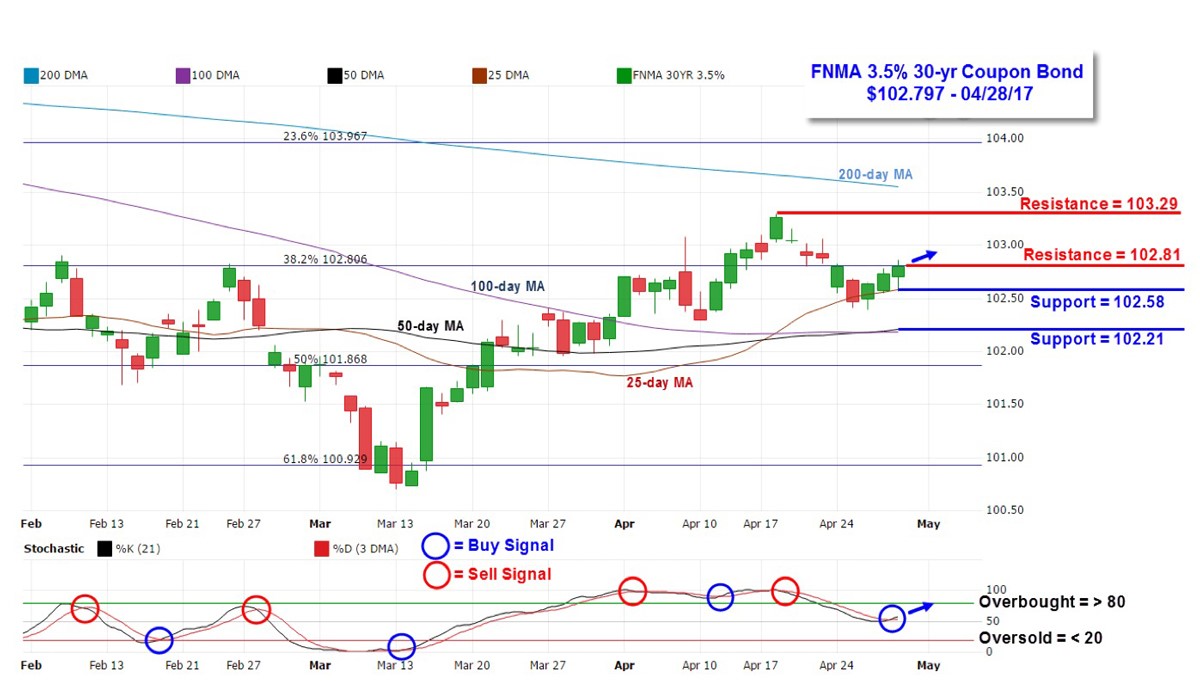
Mortgage Rate Forecast with Chart – FNMA 30-Year 3.5% Coupon Bond
The FNMA 30-year 3.5% coupon bond ($102.80, -7.8 bp) traded within a narrower 47 basis point range between a weekly intraday high of $102.86 on Friday and a weekly intraday low of $102.39 on Wednesday before closing the week at $102.80. Mortgage bonds initially traded down to test support at the 25-day moving average early in the week before bouncing higher for a test of nearest resistance at the 38.2% Fibonacci retracement level ($102.806). This bounce higher in the later portion of the week resulted in a positive stochastic crossover buy signal. If the bond manages to break above resistance during this coming week that features numerous potential market-moving economic reports, we could see higher prices and lower yields resulting in a slight improvement in rates.


