Oil stocks drop to 10-month lows
The stock market moved modestly higher during the week with intermittent strength shown in the financial, health care and technology sectors that was countered by considerable weakness in energy sector. In fact, oil stocks officially entered into a bear market with a decline of 20% from their recent highs to end at 10-month lows. Bond yields ended the week slightly lower.
The housing sector was prominently featured in the week's economic news and included the latest mortgage data. Mortgage application volume increased during the week ending June 16. The Mortgage Bankers Association (MBA) reported their overall seasonally adjusted Market Composite Index (application volume) rose 0.6%. The seasonally adjusted Purchase Index decreased 1.0% from the prior week while the Refinance Index increased 2.0%.
Overall, the refinance portion of mortgage activity increased to 46.6% total applications from 45.4% in the prior week. The adjustable-rate mortgage share of activity increased to 7.5% of total applications. According to the MBA, the average contract interest rate for 30-year fixed-rate mortgages with a conforming loan balance was unchanged at 4.13% with points decreasing to 0.34 from 0.35.
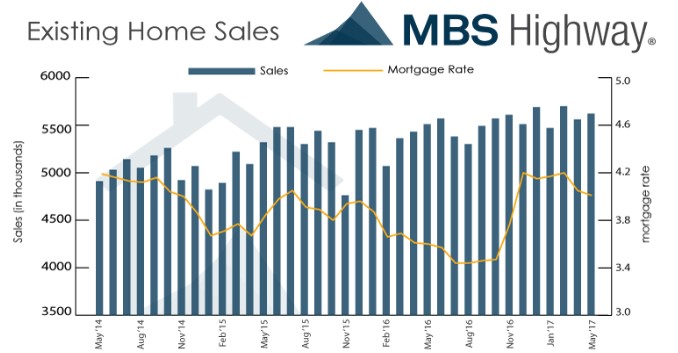
Existing-home sales in May exceeded analyst expectations, running at a seasonally adjusted annual rate of 5.62 million, according to the National Association of Realtors. May's sales were 1.1% higher from a downwardly revised April sales rate of 5.56 million and were higher than the consensus forecast of 5.52 million. May became the 63rd straight month for yearly housing price gains with the median sales price rising to $252,800, a new all-time high and 5.8% higher than a year ago. The median number of days a property now spends on the market fell to a new low of 27 days. Supply constraints coupled with robust demand continued to send housing prices higher. First-time home buyers made up 33% of all buyers in May, down from 34% in April.

Moreover, according to the Federal Housing Finance Agency (FHFA), home prices increased 0.7% in April to match an upwardly revised increase in March to 0.7% from 0.6%. Year-over-year, from April 2016 to April 2017, house prices have risen 6.8%.
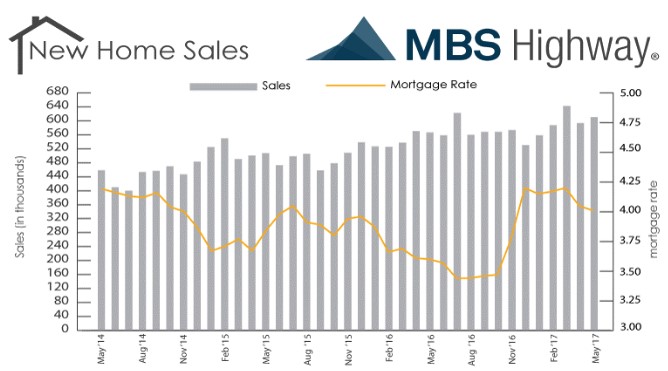
Further, the Commerce Department reported New Home Sales increased 2.9% in May to a seasonally adjusted annual rate of 610,000 to surpass the consensus forecast of 599,000. New home prices jumped higher with the year-over-year median price rising 16.8% to a record high $345,800 while the average sales price soared 16.1% to $406,400. This is further evidence of strong demand and constricted inventories in the housing market. Based on May's sales rate, the inventory of new homes for sale comprised a 5.3 month supply.

For the week, the FNMA 3.5% coupon bond gained 9.4 basis points to close at $103.25. The 10-year Treasury yield decreased 0.91 basis points to end at 2.144%. Stocks ended the week modestly higher.
The Dow Jones Industrial Average gained 10.48 points to end at 21,394.76. The NASDAQ Composite Index rose 113.49 points to close at 6,265.25 and the S&P 500 Index added 5.15 points to close at 2,438.30. Year to date on a total return basis, the Dow Jones Industrial Average has gained 7.63%, the NASDAQ Composite Index has advanced 14.08%, and the S&P 500 Index has risen 8.18%.
This past week, the national average 30-year mortgage rate fell to 3.98% from 4.00%; the 15-year mortgage rate was unchanged at 3.26%; the 5/1 ARM mortgage rate fell to 3.07% from 3.08%; and the FHA 30-year rate fell to 3.65% from 3.70%. Jumbo 30-year rates decreased to 4.25% from 4.28%.
Mortgage Rate Forecast with Chart – FNMA 30-Year 3.5% Coupon Bond
The FNMA 30-year 3.5% coupon bond ($103.25, +9.4 bp) traded within a narrower 25 basis point range between a weekly intraday low of $103.00 on Monday and Tuesday and a weekly intraday high of $103.25 on Friday before closing the week higher at $103.25. The chart reflects a mostly sideways trading pattern of consolidation as the bond moved back above the 25-day and 200-day moving averages. Although appearing range-bound between technical support and resistance levels, the bond is neither overbought nor oversold and should be able to move higher toward resistance in the coming week. Therefore, we should see mortgage rates continue to remain stable and possibly slightly improve, especially if the stock market takes a pause.

