Third-quarter GDP shows strongest economic growth in three years
The stock market ended "mixed" this past week while showing greater volatility although the major indexes once again set new all-time highs during the week. The Dow Jones Industrial Average and S&P 500 rallied almost 1% on both Tuesday and Thursday on increasing investor sentiment optimism that the Senate will soon pass their version of a tax-reform bill.
However, an increase in volatility showed up on Friday to trim weekly market gains when it was reported that President Trump's former national security advisor, Mike Flynn, made a plea bargain to testify about possible Russian interference in the 2016 election. This news should be "taken with a grain of salt" as much of the news reporting on supposed collusion by the Trump campaign with Russia has so far been disingenuous.
Economic news for the week was encouraging. Third-quarter GDP was upwardly revised to 3.3% showing the strongest period of economic growth in three years. Personal Income increased 0.4% in October as wages and salaries increased by 0.3%. Personal Spending also increased by 0.3%, as forecast. On a year-over-year basis, real disposable personal income was up 1.6%. Inflation remained tame with the PCE Price Index up 0.1%, as expected, leaving it 1.6% higher year-over-year, versus up 1.7% in September. The core PCE Price Index, which excludes food and energy, increased 0.2%, as expected. Housing data continued to show strong growth.
The Commerce Department reported New Home Sales in October rose 6.2% for the month to a seasonally adjusted annual rate of 685,000, the fastest pace in a decade. This was significantly greater than the economic consensus forecast of 629,000, and easily surpassed September's downwardly revised rate of 645,000. The median sales price increased 3.3% year-over-year to $312,800 while the average sales price jumped 13.6% to $400,200. Based on the current sales rate, the inventory of new homes for sale dropped to a 4.9-months' supply versus 5.2 months in September and the year-ago period. Regionally, large increases in the Northeast (+30.2%) and Midwest (+17.9%) led the sharp increase in overall sales.
Furthermore, the National Association of Realtors (NAR) reported Pending Home Sales in October rose by 3.5%, the most in eight months, led by a rebound in Southern regions affected by hurricanes. The consensus forecast had called for only a 0.6% increase. The NAR's chief economist, Lawrence Yun, stated "Home shoppers had better luck finding a home to buy in October, but slim pickings and consistently fast price gains continue to frustrate and prevent too many would-be buyers from reaching the market. Until new home construction climbs even higher and more investors and homeowners put their home on the market, sales will continue to severely trail underlying demand."
As for mortgages, mortgage application volume decreased during the week ending November 24. The Mortgage Bankers Association (MBA) reported their overall seasonally adjusted Market Composite Index (application volume) decreased 3.1%. The seasonally adjusted Purchase Index increased 2.0% from the prior week while the Refinance Index decreased by 8.0%.
Overall, the refinance portion of mortgage activity decreased to 48.7% of total applications from 49.9% in the prior week. The adjustable-rate mortgage share of activity decreased to 6.2% of total applications from 6.5%. According to the MBA, the average contract interest rate for 30-year fixed-rate mortgages with a conforming loan balance held steady at 4.20% with points decreasing to 0.34 from 0.42.
For the week, the FNMA 3.5% coupon bond lost 12.5 basis points to close at $102.656. The 10-year Treasury yield increased 2.32 basis points to end at 2.3633%. The major stock indexes ended the week "mixed" with the Dow and S&P 500 both moving higher while the NASADQ Composite Index retreated.
The Dow Jones Industrial Average rose 673.60 points to close at 24,231.59. The NASDAQ Composite Index lost 41.57 points to close at 6,847.59 and the S&P 500 Index gained 39.80 points to close at 2,642.22. Year to date on a total return basis, the Dow Jones Industrial Average has gained 22.6%, the NASDAQ Composite Index has advanced 27.2%, and the S&P 500 Index has added 18.0%.
This past week, the national average 30-year mortgage rate rose to 3.98% from 3.96%; the 15-year mortgage rate increased to 3.32% from 3.30%; the 5/1 ARM mortgage rate increased to 3.20% from 3.17% and the FHA 30-year rate remained unchanged at 3.60%. Jumbo 30-year rates increased to 4.16% from 4.15%.
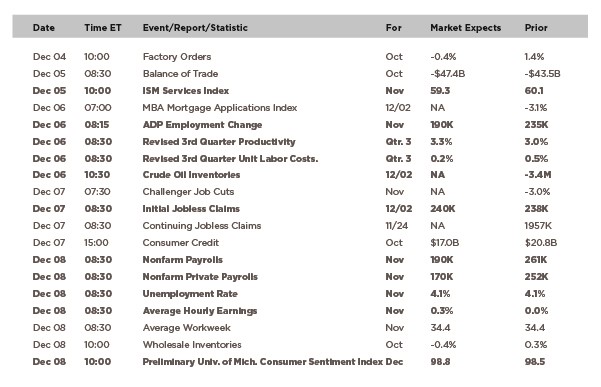
Economic Calendar – for the Week of December 4, 2017
Economic reports having the greatest potential impact on the financial markets are highlighted in bold.

Mortgage Rate Forecast with Chart – FNMA 30-Year 3.5% Coupon Bond
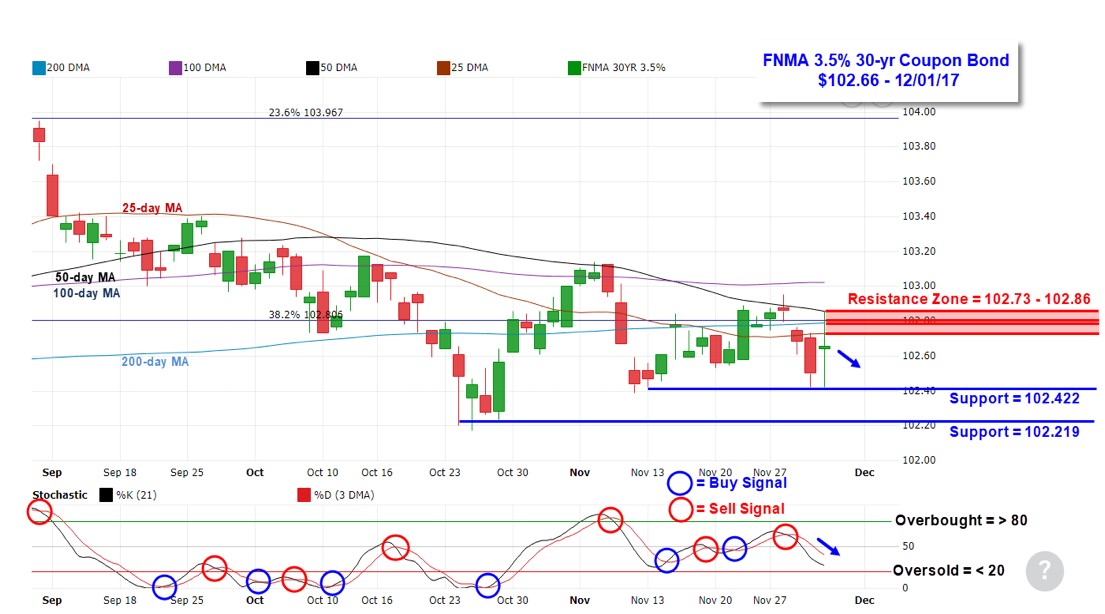
The FNMA 30-year 3.5% coupon bond ($102.656, -12.5 bp) traded within a 53.1 basis point range between a weekly intraday high of $102.953 on Tuesday and a weekly intraday low of $102.422 on Thursday and Friday before closing the week at $102.656 on Friday.
After moving higher on Monday and Tuesday just above a couple of nearby resistance levels, the bond pulled back below several of these levels while displaying an increase in volatility on Thursday and Friday. The bond is now beneath four resistance levels shown as a Resistance Zone between 102.73 and 102.86 on the chart. This zone could prove to be a formidable area of resistance for the bond to overcome, and it appears the path of least resistance is a move lower toward support. A new sell signal formed last Wednesday, and the bond is not yet "oversold" so we could see a continuing move lower to test support levels. Such a move would result in slightly worse mortgage rates.


