First quarter earnings, rate hike projections and March home sales
The stock market bounced around for most of the week, but recorded a moderate gain as investors focused on what is shaping up to be a strong first quarter corporate earnings season. Investors were also able to overlook increasing geopolitical tensions between the U.S. and Korea and an expected delay in legislation to reform the U.S. tax code.
The 10-year Treasury yield fell as low as 2.167% on Tuesday to record a five-month low on lower than expected manufacturing production and housing starts. The 10-year yield then recoiled to end the week at 2.246% after stocks continued to grind higher with the exception of oil shares. Oil prices gave back all of the previous week's gains, with West Texas Intermediate crude falling to $49.54 per barrel from last week's close of $53.25.
The broader S&P 500 Index closed the week higher by 0.9% and this led to a retreat in rate hike expectations. The fed funds futures market is now showing a 48.5% implied probability of a June rate hike, down from last week's 57.3%. Market mavens now believe July will be the most likely time for the Fed to announce its next rate hike with an implied probability of 53.6%.
Several economic reports released during the week indicated housing demand remains strong with home prices continuing to rise while home inventory remains constrained.
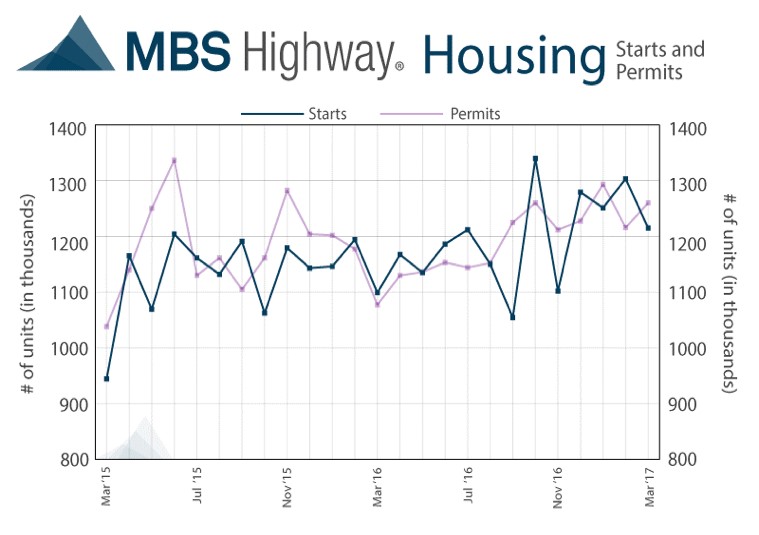
Housing starts for March were reported at a seasonally adjusted annual rate of 1.215 million units. This was slightly below forecasts of 1.256 million and 6.8% lower from February's upwardly revised rate of 1.303 million units. Single-family housing starts were down 6.1% to 821,000 while multi-unit housing starts were 7.9% lower to 394,000. However, building permits shot 3.6% higher to a seasonally adjusted annual rate of 1.260 million units, but this was entirely due to permits for multifamily residential housing as single-family permits fell 1.1% to 823,000.
Furthermore, existing home sales for March were also reported showing an increase of 4.4% to a seasonally adjusted annual rate of 5.71 million units, the largest increase in 10 years that handily exceeded the consensus estimate of 5.58 million units. Sales were 5.9% above the same period a year ago, and although total inventory increased 5.8% to 1.83 million existing homes for sale at the end of March, it is 6.6% lower than a year ago. At the current sales pace, there is only a 3.8 month supply of unsold inventory compared to an average of a 6.0-month supply typically seen in a balanced market. The median existing home price for all housing types advanced 6.8% year-over-year to $236,400, the 61st consecutive month of year-over-year gains while the median existing single-family home price gained 6.6% year-over-year to $237,800. First-time buyers comprised 32% of sales in March, up from 30% a year ago. On average, properties stayed on the market for 34 days in March compared to 45 days in February and 47 days during March 2016.
As for mortgages, mortgage application volume decreased slightly during the week ending April 14. The Mortgage Bankers Association (MBA) reported their overall seasonally adjusted Market Composite Index (application volume) fell 1.8%. The seasonally adjusted Purchase Index decreased 3.0% from the prior week, while the Refinance Index increased 0.2%. Overall, the refinance portion of mortgage activity increased to 42.4% total applications from 41.6% from the prior week. The adjustable-rate mortgage share of activity decreased to 8.4% of total applications. According to the MBA, the average contract interest rate for 30-year fixed-rate mortgages with a conforming loan balance decreased to 4.22% from 4.28%, its lowest level since November 2016, with points decreasing to 0.35 from 0.38.
For the week, the FNMA 3.5% coupon bond dropped 12.5 basis points to close at $102.88 while the 10-year Treasury yield increased 1.43 basis points to end at 2.246%. Stocks ended the week higher. The Dow Jones Industrial Average rose 94.51 points to end at 20,547.76. The NASDAQ Composite Index advanced 105.37 points to close at 5,910.52 and the S&P 500 Index added 19.74 points to close at 2,348.69. Year to date, the Dow Jones Industrial Average has gained 3.97%, the NASDAQ Composite Index has advanced 9.80%, and the S&P 500 Index has risen 4.91%.
This past week, the national average 30-year mortgage rate rose to 4.05% from 4.04%; the 15-year mortgage rate increased to 3.29% from 3.27%; the 5/1 ARM mortgage rate decreased to 3.04% from 3.07%; and the FHA 30-year rate was unchanged at 3.75%. Jumbo 30-year rates rose from 4.31% to 4.32%.
Economic Calendar – for the Week of April 24, 2017
Economic reports having the greatest potential impact on the financial markets are highlighted in bold.
Mortgage Rate Forecast with Chart – FNMA 30-Year 3.5% Coupon Bond
The FNMA 30-year 3.5% coupon bond ($102.88, -12.5 bp) traded within a narrower 50 basis point range between a weekly intraday high of $103.30 on Tuesday and a weekly intraday low of $102.80 on Thursday before closing the week at $102.88. Mortgage bonds broke above resistance located at $103.13 on Tuesday but fell back toward support at the 38.2% Fibonacci retracement level ($102.806) during the remainder of the week. The bond was substantially "overbought" for most of the week, and a sell signal from a negative stochastic crossover took place on Wednesday to help drive prices toward support. If the bond continues to move lower to break below primary support, we could see prices slide toward the 25-day moving average, in which case mortgage rates would rise slightly higher.